|
Hypothesis: If we are able to see bacterial transformation using DNA plasmid and E. Coli, then GFP will give off a green glow when held under UV light due to bacterial colonies being produced. Components:
Reagents & Supplies: Store all components below at room temperature:
Requirements:
Pre-Lab Questions: 1. On which plate(s) would you expect to find bacteria most like the E. coli on the source plate? Explain. I would expect to find bacteria most like E. coli on the -DNA source plate because on the -DNA source plate it is just unaffected E. coli. There were no antibiotics put into the source plate. 2. On which plate(s) would you find only genetically transformed bacterial cells? Why? I would find only genetically transformed bacterial cells in the +DNA/+Amp/+IPTG because the bacteria would absorb the glo DNA and would help it transform since it contains ampicillin and isopropyl-ß-D-thiogalactopyranoside. 3. What is the purpose of the control plates? Explain the difference between the controls and why each one is necessary. The purpose of the control plates is to compare E. coli and how it reacts towards different factors. The difference between the two control plates is that the -DNA plate shows regular E. coli, while the -DNA/+Amp shows how regular E. coli handles ampicillin. 4. Why would one compare the -DNA/+Amp and +DNA/+Amp plates? We would compare the -DNA/+Amp and +DNA/+Amp plates because we want to see how ampicillin affects unaltered E. coli (-DNA/+Amp) and how ampicillin affects the E. coli with plasmid (+DNA/+Amp) to see if the outcome is different. Laboratory Safety:  Transformation experiments contain antibiotics to select for transformed bacteria. *Students who have allergies to antibiotics such as penicillin, ampicillin, kanamycin or tetracycline should not participate in this experiment.* 1. Wear gloves and goggles while working in the laboratory. 2. Exercise extreme caution when working in the laboratory - you will be heating and melting agar, which could be dangerous if performed incorrectly. 3. DO NOT MOUTH PIPET REAGENTS - USE PIPET PUMPS OR BULBS. 4. The E. coli bacteria used in this experiment is not considered pathogenic. Regardless, it is good practice to follow simple safety guidelines in handling and disposal of materials contaminated with bacteria. A. Wipe down the lab bench with a 10% bleach solution or a laboratory disinfectant. B. All materials, including petri plates, pipets, transfer pipets, loops and tubes, that come in contact with bacteria should be disinfected before disposal in the garbage. Disinfect materials as soon as possible after use in one of the following ways: • Autoclave at 121° C for 20 minutes. Tape several petri plates together and close tube caps before disposal. Collect all contaminated materials in an autoclavable, disposable bag. Seal the bag and place it in a metal tray to prevent any possibility of liquid medium or agar from spilling into the sterilizer chamber. • Soak in 10% bleach solution. Immerse petri plates, open tubes and other contaminated materials into a tub containing a 10% bleach solution. Soak the materials overnight and then discard. Wear gloves and goggles when working with bleach. 5. Always wash hands thoroughly with soap and water after working in the labora- tory. 6. If you are unsure of something, ASK YOUR INSTRUCTOR! Procedures: 1. LABEL one microcentrifuge tube with “+DNA” and a second microcentrifuge tube with “-DNA”. 2. TRANSFER 500 μL ice-cold CaCl2 solution into the ”– DNA” tube using a sterile 1 mL pipet. 3. Using a toothpick, TRANSFER approx. 15 well-isolated colonies (each colony should be approx. 1-1.5 mm in size) from the E. coli source plate to the “-DNA” tube. 4. TWIST the toothpick between your fingers to free the cells. RESUSPEND the bacterial cells in the CaCl2 solution by vortexing vigorously until no clumps of cells are visible and the cell suspension looks cloudy. 5. TRANSFER 250 μl of the cell suspension to the tube labeled “+ DNA”. PLACE tubes on ice. 6. ADD 10 μl of pFluoroGreen TM DNA (pGFP) to the tube labeled “+ DNA”. DO NOT add pGFP to the “-DNA” tube. 7. INCUBATE the tubes on ice for 10 minutes. 8. PLACE the transformation tubes in a 42° C water bath for 90 seconds. 9. Immediately RETURN the tubes to the ice bucket and INCUBATE for two minutes. 10. TRANSFER 250 μL of Recovery Broth to each tube using a sterile 1 mL pipet. Gently MIX by flicking the tube. 11. INCUBATE the cells for 30 minutes in a 37° C water bath. 12. While the cells are recovering, LABEL the bottom of four agar plates as indicated below. -DNA (plate with no stripe) -DNA/+Amp (plate with one stripe) +DNA/+Amp (plate with one stripe) +DNA/+Amp/+IPTG (plate with two stripes) 13. After the recovery period, REMOVE the tubes from the water bath and place them on the lab bench. 14. Using a sterile 1 ml pipette, TRANSFER 250 μL recovered cells from the tube labeled “ –DNA “ to the middle of the -DNA and -DNA/+Amp plates. 15. Using a new sterile 1 ml pipette, TRANSFER 250 μL recovered cells from the tube labeled “ +DNA “ to the middle of the +DNA/+Amp and +DNA/+Amp/+IPTG plates. 16. SPREAD the cells over the entire plate using an inoculating loop. Use one sterile loop to spread both -DNA samples. Change to a fresh loop before spreading the +DNA samples. Make sure the cells have been spread over the entire surface of the plates. COVER the plates and WAIT five minutes for the cell suspension to be absorbed by the agar. 17. STACK the plates on top of one another and TAPE them together. LABEL the plates with your initials or group number. PLACE the plates in the inverted position (agar side on top) in a 37° C bacterial incubation oven for overnight incubation (16-18 hours). If you do not have an incubator, colonies will form at room temperature in approximately 24 - 48 hours. 18. VISUALIZE the transformation and control plates using long wave U.V. light. For each of the plates, RECORD the following: • The number of colonies on the plate. • The color of the bacteria under UV light.   Experiment Results & Analysis *The data below is based off of Christopher's bacteria plates.* First Column: Bacteria Plates Second Column: How much bacterial growth do you observe? Determine a count. Third Column: What color are the bacteria? Fourth Column: Why do different members of your class have different transformation efficiencies? Fifth Column: If you did not get any results, what factors could be attributed to this fact? Sixth Column: Picture Transformation Efficiency: +DNA/+AMP: 100 transformant x 0.5 mL = 1.25 x 10^-3 transformants / μg 10,000μg 0.25mL +DNA/+AMP/+IPTG: 11 transformant x 0.5 mL = 2.2 x 10^-3 transformants / μg 10,000μg 0.25mL Study Questions:
1. Exogenous DNA does not passively enter E. coli cells that are not competent. What treatment do cells require to be competent? When CaCl2 is added, it helps make the E. coli competent. It helps promote binding of plasmids and bacteria since the E. coli cells are now competent to any plasmids. 2. Why doesn’t the recovery broth used in this experiment contain ampicillin? The recovery brother doesn’t contain ampicillin because the ampicillin would kill off the bacteria because it is not ampicillin resistant which would lead to not being able to compare the bacteria to a control plate. 3. What evidence do you have that transformation was successful? Both of the variable plates are evidence because both showed growth and were multiplied. There was also nothing on the control plate, like colonies, when it also had ampicillin. This shows that the DNA with the DNA plasmid dies because it doesn't have the genes to not be killed off, but the bacteria that contains the bacteria isn’t killed due to the ampicillin. 4. What are some reasons why transformation may not be successful? Transformation may have not been successful because the amount of time the bacteria was suspended was too long/short or the temperature of the bacteria might not have been changed correctly so the bacteria could have rejected the plasmids creating no transformation at all. 5. What is the source of the fl uorescence? Why are some cells fluorescent and other cells not fluorescent? The source of the fluorescence is the GFP which is produced by the bacteria after being transformed from the pGFP and the IPTG to allow the gene that controls GFP production to be activated, GFP absorbs the blue light and gives off green light in response. Some cells are not fluorescent because it could have taken a longer time for IPTG to activate the GFP gene. Conclusion: In conclusion, my hypothesis was correct because the fluorescence is the GFP which is produced by the bacteria after being transformed from the pGFP and the IPTG to allow the gene that controls GFP production to be activated, GFP absorbs the blue light and gives off green light in response and we were able to see the colonies that were produced. Possible errors that could have occurred are that they could have not added the correct substances into the correct plates or they could have messed up their control plate and added ampicillin which would kill the bacteria leaving nothing to compare the other plates to. Possible changes would be to make sure to keep the bacteria inside the water baths for the correct amount of time and to make sure you know what you are doing so that you don’t mix up the plates and so you know what substances to add into each plate. Materials: Original Oreos Sprinkles Napkins Chromebook with internet Camera (phone) Investigation 1: Models Part 1: Modeling Mitosis Hypothesis: If a model of mitosis is built out of oreo cookies then we would get an accurate view and better understanding of mitosis. Procedures: 1. Obtain 4-6 Oreo cookies and twist the Oreos sideways in order to separate the frosted side from the non-frosted side. Make sure only one side has the frosting and the other does not. 2. Obtain sprinkles. These will be used to create the mitosis on the frosting. 3. Create the different phases of mitosis using the sprinkles and putting them on the frosted side of the Oreo. 4. Record data by taking pictures of the Oreos. Key: Oreo Cookie: Cell Oreo Cream: Nuclear Envelope Sprinkles: Chromosomes and Spindle Fibers 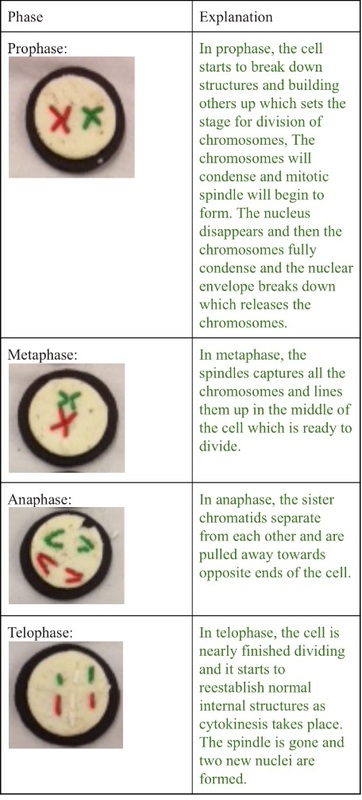 Justification: My model shows a simplistic version of mitosis and a visual representation of the phases that create two daughter cells from cell division. Analysis Questions:
Conclusion: This lab was a success in my opinion. Errors that occurred were not all the frosting staying on just one side of the cookie and the breaking of cookies. You can easily see and understand how mitosis works and how two daughter cells are created by cell division. Part 2: Meiosis Hypothesis: If a model of meiosis is built out of oreo cookies then we would get an accurate view and better understanding of meiosis. Procedures:
Key: Oreo Cookie: Cell Oreo Cream: Nuclear Envelope Sprinkles: Chromosomes and Spindle Fibers 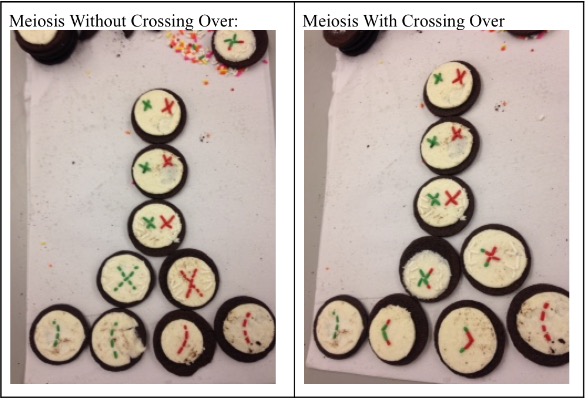 Prophase I: The chromosomes condense, and the nuclear envelope breaks down. Crossing Over: Crossing over then occurs which is the exchange of genes between chromosomes. Metaphase I: Pairs of homologous chromosomes move to the center of the metaphase plate. Anaphase I: Homologous chromosomes move to the opposite poles of the cell. Telophase I: Chromosomes gather at the poles of the cells and the cytoplasm divides. Prophase II: A new spindle forms around the chromosomes of the cell. Metaphase II: Chromosomes line up at the center of the metaphase plate. Anaphase II: Centromeres divide and chromatids move to the opposite poles of the cell. Telophase II: A nuclear envelope forms around the chromosomes and spindle fibers are completely gone and two nuclei are formed. Cytokinesis: Four haploid cells are produced. Justification: My model shows a simplistic version of meiosis and a visual representation of the phases that create four daughter cells through cell division which results in half the chromosomes of the parent cell. Analysis Questions:
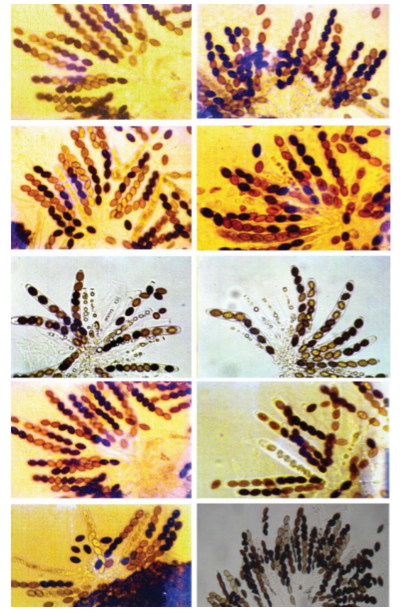
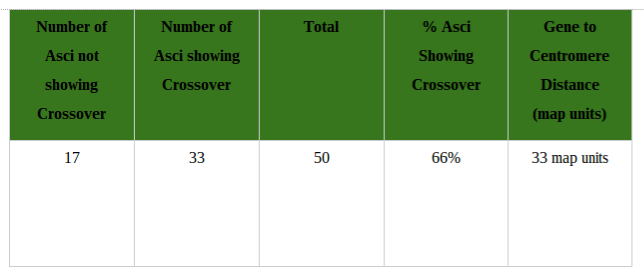
Conclusion: In conclusion, this part of the lab was very complex and difficult, and errors did occur. It was hard to understand pictures of meiosis and relay it with the Oreos. If I had more background information on meiosis, this part of the lab would be a lot better. Overall, the information I provided shows how meiosis occurs and how it creates four daughter cells through cell division in the end. Investigation 2: Studying the Effects of Environment on Mitosis Part 3: Time Spent in the Phases of Mitosis (this link is in case the other stuff doesn’t work) Hypothesis: If the procedure is successful, then we will be able to see the onion root tip go through the cell cycle during the experiment. Procedures: 1. Initially, go to the following link: http://www.biology.arizona.edu/cell_bio/activities/cell_cycle/01.html. 2. Categorize the cells into the five different phases. 3. Once that is sorted out, count up the number of cells in each category and record your data into the table below. 4. Then, you find the percent of the cells in each phase by dividing the amount of cells that was recorded in each phase and divide it by the total amount of cells. 5. Multiply the percent by 1,440 minutes to find the time that they were in each stage. 6. Record your data by putting it into the table below. 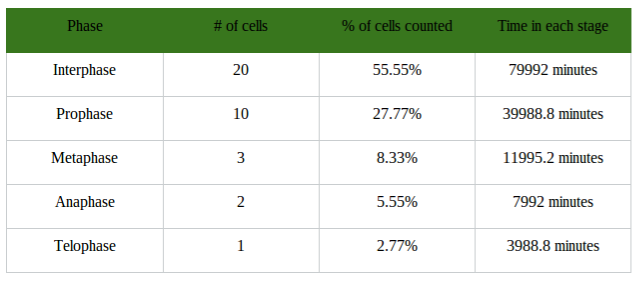 Conclusion: Based on the chart, we can now see the amount of time each phase took, how many cells there are, and how each phase performs individually. I used the website because I did not get to see the entire cell cycle. Errors could have occurred with my calculations, but overall this experiment showed that not all experiments will be successful. Investigation 4: Loss of Cell Cycle Control in Cancer Part 4: Karyotypes 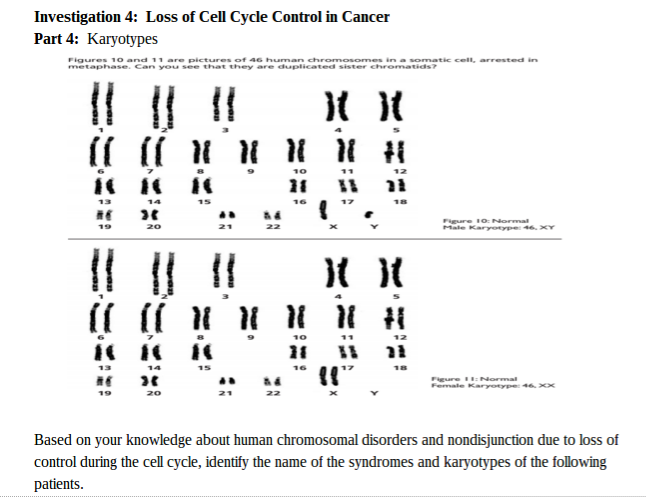 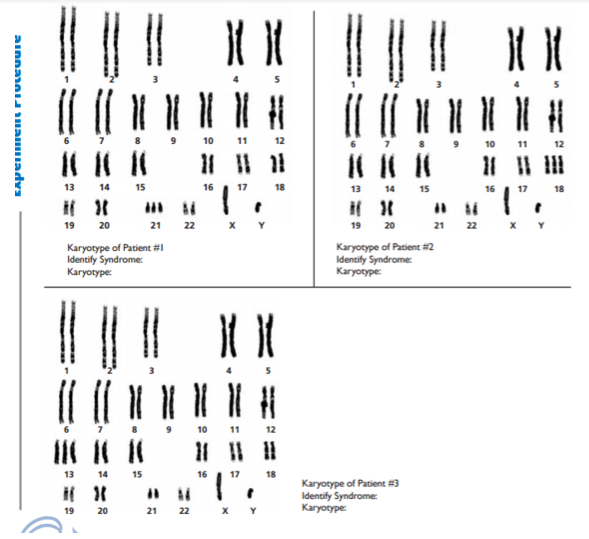 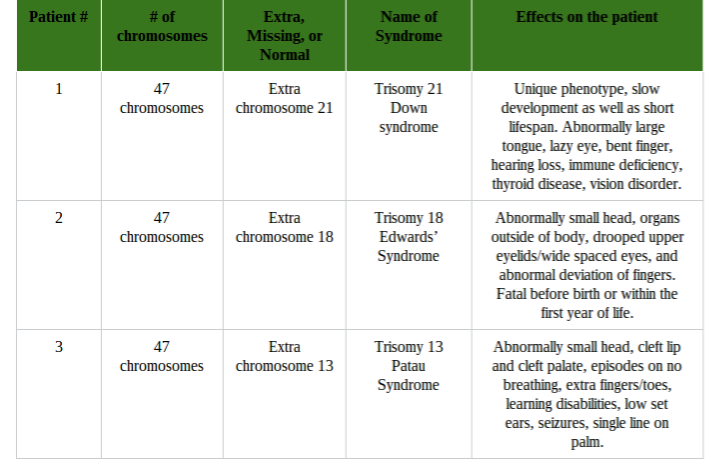 Conclusion: When it comes to the amount of chromosomes we have, we need to keep it at exactly 46 chromosomes. If we are lacking a chromosome or are exceeding the limit of chromosomes then we won’t be able to function properly and will have many disabilities. It would be very hard to live life if we were to not have 46 chromosomes. Investigation 5: Meiosis and Crossing Over in Sordaria Part 5: Meiosis and Crossing Over in Sordaria Study the pictures of Sordia in the picture below by counting at least 50 asci and scoring them as either parental or recombinant.
 Analysis Questions:
 Conclusion:
In conclusion, this chart shows that 66% of offspring will have different genetics from their parents. It also shows how crossing over is common since crossing over is mixing genes from their parents. Without crossing over, they would either only look like their mother, or only look like their father. Some errors could have been miscounting the Asci. Overall, this showed me that not all chromosomes cross over during meiosis and simply stay in line which I thought was very interesting. Background Information: This experiment is designed to measure oxygen consumed by either germinating or nongerminating pea seeds. To measure consumed oxygen, the ideal gas law will be utilized. During this experiment, a respirometer will be used to measure the volume of oxygen, and therefore the number of molecules of oxygen, consumed by the pea seeds during cellular respiration. The number of oxygen molecules consumed during respiration by the pea seeds will be directly related to the decrease in volume occupied by gas within the respirometer. The water in the pipet will move toward the region of lower pressure, which is created within the respirometer due to oxygen consumption. This assumes constant volume and pressure of the system. The control vial containing the glass beads will be used to measure any change in water volume due to alterations of temperature and pressure. The data will be corrected to reflect these external influences on the respirometer. Experiment Objective: The objective of this experiment is to apply the gas laws to the function of the respirometer. Students will observe cell respiration of germinating and nongerminating seeds and describe the effects of temperature on the rate of cell respiration. Laboratory Safety Guidelines: 1. Wear gloves and goggles while working in the laboratory. 2. Exercise caution when working in the laboratory – you will be using equipment that can be dangerous if used incorrectly. 3. DO NOT MOUTH PIPET REAGENTS - USE PIPET PUMPS. 4. Always wash hands thoroughly with soap and water after working in the laboratory. 5. If you are unsure of something, ASK YOUR INSTRUCTOR! Before Starting the Experiment: • Carefully read the introduction and the protocol. Use this information to form a hypothesis for this experiment. • Predict the results of your experiment. During the Experiment: • Record your observations. After the Experiment: • Interpret the results – does your data support or contradict your hypothesis? • If you repeated this experiment, what would you change? Revise your hypothesis to reflect this change. Materials for the Experiment: Each student group should receive the following:
Taking Experimental Measurements 1. Set up an ice bath at 10° C and a room temperature bath (24° C) as assigned by the instructor. This should be done prior to beginning the other steps in order to allow enough time for the water baths to equilibrate to the required temperature. To attain and keep the 10° C temperature, add ice. 2. Label 6 vials (respirometers) A, B, C, D, E and F. • Place a circle of absorbent cotton (approximately the size of a nickel) into the bottom of each vial. • Carefully soak with 1- 2 ml of 15% KOH solution, not allowing any KOH solution to touch the side walls of the vials. • Place a circle of nonabsorbent cotton into the vials directly on top of the KOH/cotton circle in the vial. This will keep the KOH solution from touching peas during the experiment. 3. Determine the volume of germinated peas. • Fill a 100 ml graduated cylinder with 50 ml of water. • Add 25 germinated peas to the cylinder and measure the increase in water volume. The difference represents the volume of the peas. Pea volume = __________ ml. • Place the peas on a paper towel. These germinated peas will be used in Vial A. • Repeat steps for Vial D. 4. Determine the volume of non-germinated peas. • Fill a 100 ml graduated cylinder with 50 ml water. • Add 25 non-germinating peas. • Add glass beads to raise the volume to equal that obtained with swollen germinated peas. • Remove the peas and beads. Place them on a paper towel. The non-germinated peas and beads will be used in respirometer B. • Repeat steps for Vial E. 5. Determine the volume of glass beads. • Fill the 100 ml graduated cylinder with 50 ml water. • Add glass beads to raise the volume so it equals the volume of germinating peas as determined previously in Step 3. • Place glass beads on a paper towel, to be used in Vial C. • Repeat steps for Vial F. 6. Place one set of germinating peas into Vial A. Insert the cork/pipet assembly into the vial. Repeat with the second set of germinating peas for Vial D. 7. Place one set of non-germinated peas + glass beads into Vial B. Insert the cork/pipet assembly into the vial. Repeat with the second set of non-germinated peas + glass beads for Vial E. 8. Place one set of glass beads into Vial C. Insert the cork/pipet assembly into the vial. Repeat with the second set of glass beads for Vial F. 9. Wrap Parafilm® or plastic wrap tightly around the seams (cork and tube) to seal any potential leak. 10. Make sure the ice water bath has equilibrated to 10° C. Record the temperature of the room temperature bath. 11. Place a piece of masking or lab tape over the water bath to suspend pipet tips out of the water during the equilibration phase. 12. Place Vials A, B & C into the 10° C water bath and Vials D, E & F into the 24° C water bath. Place them with the calibrated side of the pipet facing up to allow measurements to be taken. 13. Allow the respirometers to equilibrate in the water baths for 8 minutes. 14. After the equilibration phase, immediately submerge each respirometer. Water in the water bath will enter the pipette and travel a short distance. As respiration occurs inside the vials, oxygen is consumed and the pressure drops. Over time, as pressure drops, additional water from the water bath enters the pipets. Make sure the vials do not fill up with water. If it does, there is a leak which must be corrected. Reassemble the faulty respirometer. 15. Arrange the vials so you can read the volume markings on each pipet. Place lead donuts or other weighted objects on the vials to keep vials submerged. 16. Record the starting temperature. Maintain temperature by adding ice or water as necessary during the experiment. 17. Record the starting point (“Time 0”) volume of each pipet. Take readings of the volume of water in each pipet every 5 minutes for 20 minutes. Record these values in the tables on the following page. 18. Collect class data for Vials A, B, C, D, E and F for both temperature water baths. 19. Correct volumes measured for changes in environmental variables. • Vial C (and F) measures volume changes due to environmental variables. For Vial C, the environmental effects are calculated by subtracting the volume at given time (Tx) volume at starting time (T0). This can be written as: Vial C volume at Tx - Vial C volume at T0. • Environmental effects must be applied to data collected for vial A (and D) as shown below: [ Vial A volume at Tx - Vial A volume at T0] - [ Vial C volume at Tx - Vial C volume at T0] • Environmental effects must be applied to data collected for vial B (and E) as shown below: [ Vial B volume at Tx - Vial B volume at T0] - [ Vial C volume at Tx - Vial C volume at T0] Mrs. Blake’s Data 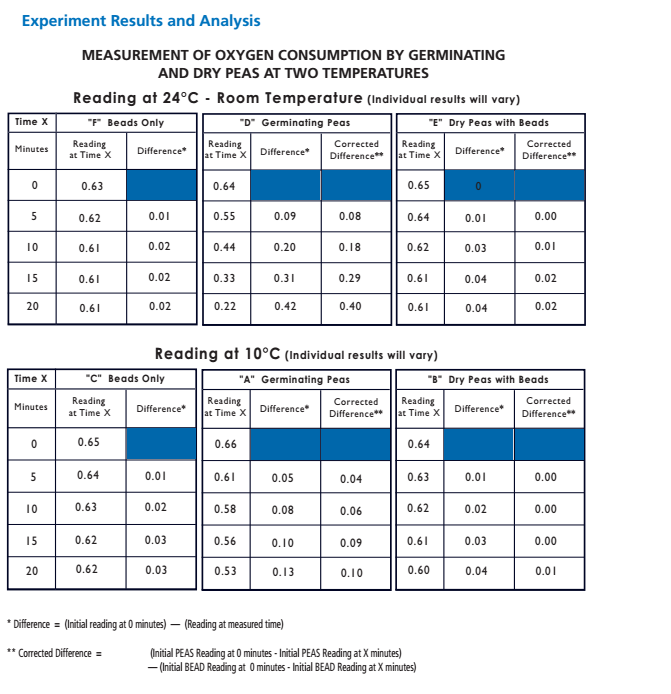 Hypothesis: If there are two water baths, one at 10°C and another at 24°C, then the vials in the warm bath will have a better rate of cellular respiration. Experiment Results and Study Questions Answer the following study questions in your laboratory notebook or on a separate worksheet. 1. Graph your corrected data (difference) for Vials A, B, C, D, E, and F. Place time (in minutes) on the x-axis and volume (ml O2) temperatures should be plotted on the same graph. Draw the best straight line through the data points. 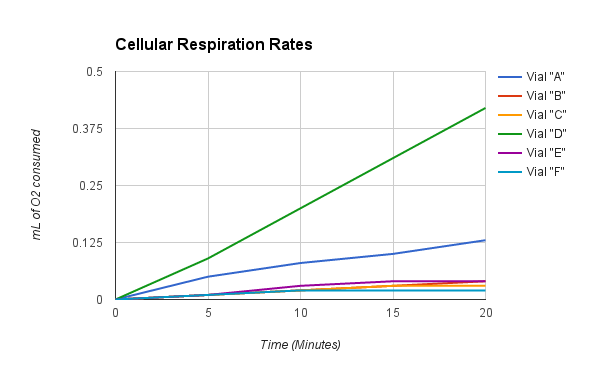 Graph Justification: This graph represents the corrected difference of each vial when it is at 24°C and 10°C. The corrected difference is the difference of the volume of the peas at time X and the volume of the beads, in my case the white glass beads, at time X. 2. What accounts for the difference in oxygen consumption seen between the germinating and nongerminating seeds? The difference in oxygen consumption seen between the germinating and nongerminating seeds was that the germinated peas are living and the nongerminating seeds are not living and because of this, they will consume more oxygen because they would respire more to create glucose and the nongerminating peas are not as active, but at the same time are consuming less oxygen since they aren’t living. 3. List some of the constant controls in this experiment. Some of the constant controls in this experiment were the white glass beads, the germinated peas, and the non germinated peas. 4. Why do the glass beads seem to be using oxygen? The glass beads seem to be using oxygen because it creates an illusion that oxygen is being used when in reality, an air bubble could have been formed which created a bubble in the respirometer. 5. Why are the readings corrected using the glass bead values? The readings are corrected using the glass bead values by using the vials the beads were in which trapped the air in the first place and if you subtract this value from the values of the germinated peas and non-germinated peas then you can reduce the error and get more accurate data. 6. What is the function of KOH in this experiment? The function of KOH in this experiment is to absorb the carbon dioxide that is inside of the vials so that it will not affect the gas volumes. 7. From the slope of the lines, determine the rate of oxygen consumption at 10°C room temperature for the germinating and nongerminating pea seeds. Determine the slope of the lines over a middle section of each line by dividing the difference in volume reading by the difference in time. Volume (ml O2 consumed) values are determined from the line. 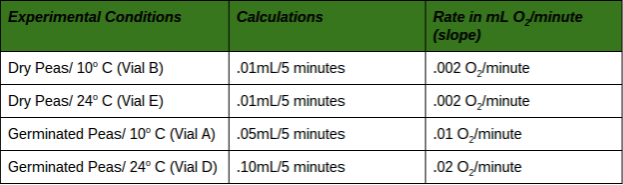 Experiment Results and Study Questions 8. Compare the rate of oxygen consumption at 10°C and room temperature. How are they different? As the peas germinate longer, the rate of cellular respiration will increase as they germinate longer. The peas need the energy from cellular respiration to be able to shoot out of the ground and eventually perform photosynthesis. As the pea continues to grow, more energy is needed to sustain the pea's growth, increasing the rate of cellular respiration. 9. How do you think the rates of respiration would change in peas that have been germinating for 0, 24, 48, 72, and 96 hours. Why? The rates of respiration would change in peas as the peas germinate longer. The rate of cellular respiration would increase as they germinate longer. The peas need the energy from cellular respiration to be able to perform photosynthesis. Therefore, going from 0 to 96, the peas would continue to grow and more energy would be needed which in turn would increase the rate of cellular respiration. 10. Write a hypothesis using the same experimental design to compare the rates of respiration in a mouse at both room temperature 24° C and at 10° C. If a mouse was exposed to the two following temperatures, 24° C and at 10° C, then the mouse would have a faster rate of cellular respiration. In a mouse, the rate of respiration would be a lot higher because the organism is much bigger than the pea and can consume oxygen at a much faster rate. Although it has a higher amount of oxygen consumed, the mouse would have the same reaction to the difference in temperature as the peas because as it gets colder, the mouse will focus more on keeping its body warm. 11. Using the same experimental design, write a hypothesis to test the respiration rate of a 15 g reptile and a 15 g mammal at 10° C. In a 15 g reptile, the cellular respiration rate will not change based on temperature because they're cold blooded organisms who don't need to keep their body warm by using the energy from cellular respiration. A 15 g mammal will consume at a much faster rate in general, but the rate will decrease as the temperature decreases because the organism's metabolism will also decrease in order to keep its body warm. 12. What basic cellular process is responsible for the oxygen consumption? The basic cellular process that is responsible for oxygen consumption is cellular respiration. Cellular Respiration, ETC, and the Krebs Cycle are responsible for the oxygen consumption because these are the phases in which CO2 is produced and O2 is formed. Experiment Results and Study Questions Graph the results from the Corrected Difference column for the germinated peas and dry peas at both room temperature and at 10° C. Label the horizontal x-axis "Time in Minutes.” Label the vertical y-axis "ml O2 Consumed.” 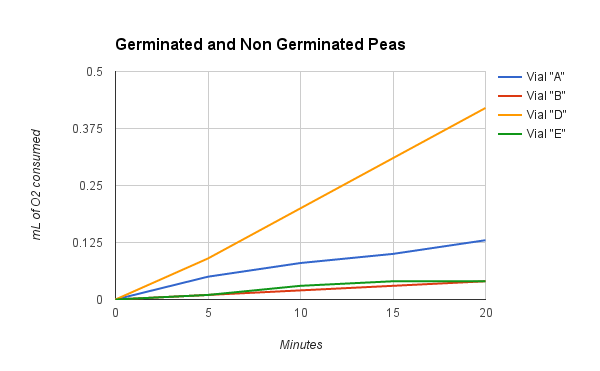 Graph Justification:
This graph represents the corrected difference of the germinated and non-germinated peas when it is at 24°C and 10°C. The corrected difference is the difference of the volume of the peas at the time X and the volume of the beads at time X. What is the independent variable? The independent variable would be the time in minutes. What is the dependent variable? The dependent variable would be the volume of that oxygen that is being consumed. What two hypotheses are being tested in this experiment? If the germinating and nongerminating peas are placed in their own container under water, then the nongerminating peas won't produce any oxygen bubbles while the germinating peas will produce air bubbles in their container. If both the germinated and non germinated peas are placed in room temperature water (24°C), then they will consume oxygen faster than the 10°C water. Conclusion: Overall, our hypothesis was correct. The results show that the 10°C temperature water slows down the process of cellular respiration and that the vials in the room temperature water of 24°C has a faster rate of cellular respiration. Possible errors that could have been made in this experiment were that the vials were not sealed correctly or you could have not kept track of the time, therefore you did not collect your data in the appropriate time frame. Background Information: While scientist continue to identify genes that cause disease or phenotypic differences (tall versus short), there is a growing danger to see humans merely as a sum of their genes. Understanding the legal, and social implications of genetic knowledge, and the development of policy options for public consideration are therefore yet another major component of the human genome research effort. In order to gain experience in database searching, students will utilize the free service offered by the National Center for Biotechnology (NCBI) which can be accessed on the internet. At present there are several Databases of Genbank including the GenBank and EMBL nucleotide sequences, the non-redundant GenBank CDS (protein sequences) translations, and the EST (expressed sequence tags) database. Students can use any of these databases as well as others available on the internet to perform the activities in this lab. Experiment Objective: The objective is to become familiar with databases that can be used to investigate gene sequences and to construct cladograms that provide evidence for evolutionary relatedness among species. In this investigation, students will:
Experiment Components/Requirements:
Laboratory Safety Guidelines:
Before Starting the Experiment:
During the Experiment:
After the Experiment:
Investigation 1: Understanding a Cladogram Exercise 1 Chimpanzees and humans share 96% of their DNA which would place them closely on a cladogram. Humans and fruit flies are placed farther apart on a cladogram since they share only approximately 60% of their DNA. This cladogram shows the evolutionary relationship between humans, chimpanzees, and fruit flies.  Exercise 2  Question 1: According to the cladogram, what organisms have hair? According to the cladogram, the organisms that have hair are the tiger and the gorilla. Question 2: According to the cladogram, what four structures do tigers possess? According to the cladogram, the four structures that tigers possess are jaws, lungs, dry skin, and hair. Question 3: According to the cladogram, which structure evolved first between lungs and dry skin? According to the cladogram, the structure that evolved first were the lungs between lungs and dry skin. Exercise 3 Use the following data to construct a cladogram of the major plant groups in the space provided below. 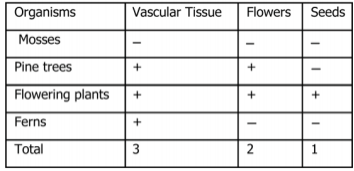 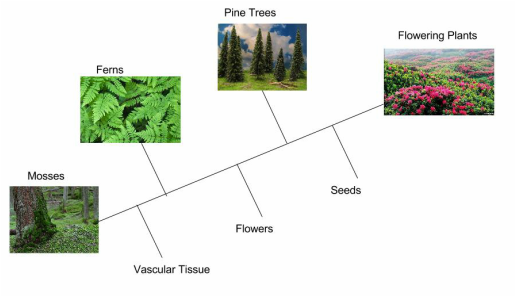 Investigation 2: Building Simple Cladograms Exercise 4 GAPDH (glyceraldehyde 3-phosphate dehydrogenase) is an enzyme that participates in glycolysis, an important reaction in the process of cellular respiration. The following table shows the percentage of similarity of this gene and the protein it expresses in humans versus other species. 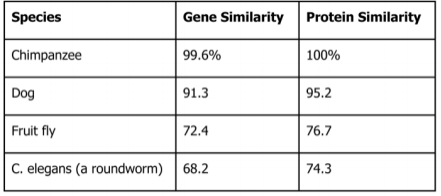 1. Why is the percentage of similarity in the protein always higher than the percentage of similarity in the gene for each of the species? The percentage of similarity in the protein is always higher than the percentage of similarity in the gene because organisms can have the same proteins with different amino acids and some changes or differences in genes may not change the amino acids or could but it would not affect the outcome of the protein. 2. In the space below, draw a cladogram depicting the evolutionary relationships between all five species based on their percentage of similarity in the GAPDH gene. 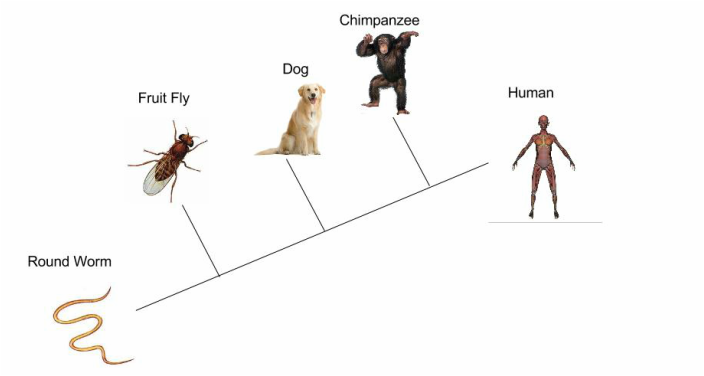 Justification: Chimpanzees and humans share 99% of the same DNA, therefore they are on the far right hand side. Dogs and humans share 91% of the same DNA, so they are on the right side, by chimpanzees. Fruit flies and humans share 72% of the same DNA, so they are further on the left side. Lastly, the round worm and humans share 68% of the same DNA, making them the farthest away. Investigation 3: Uncovering Fossil Specimen using BLAST 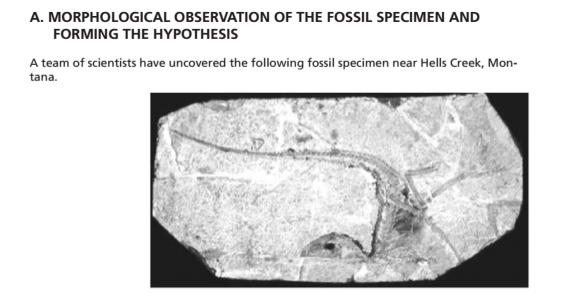 Observations: Looking at the picture, I immediately noticed the very long tail that is significantly longer than its body that is, what seems to be, all bone. You can also clearly see two legs and its head is pointed at the end as if it were a dinosaur or type of lizard based off of the small body frame.  Materials: 1. Chromebook 2. Internet Access 3. Gene Files 4. BLAST Website Procedure:
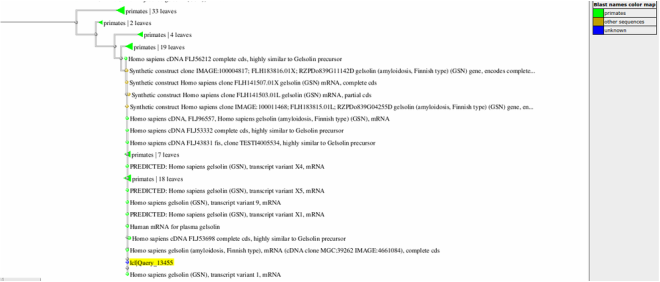
Hypothesis: If the unknown species shares the same characteristics and DNA as the bird, then the unknown species could have been a type of small dinosaur.  Justification: The unknown fossil that was found, I presume, is branched next to birds and crocodilians because it is very similar to the bird (according to the data) and the fossils physical traits, like its tail for instance, matches that of a crocodilian. Conclusion: Since evidence shows that physically they are related and our results show that gene sequences between the crocodilians, birds, and the unknown fossil are related, then this unknown fossil must be next to the bird species and on the same branch as the crocodilian. Possible sources of error could have been misinterpretation of the picture of the unknown species and or reading the data wrong. If we were to have to repeat this experiment, some changes I would make would be to clearly understand reading the data better before moving on from that step. Questions: Gene 1: 1. What species has the most similar gene sequence as your gene of interest? The species that has the most similar gene sequence as my gene interest was the birds species based on the four genetic trees and the amount of leaves on the bird species. 2. Where is that species located on the cladogram? The species is located on the birds/crocodilians branch because not only is it related to the bird, but it is also of the crocodilian family since its characteristics are related to the unknown species. 3. How similar is that gene sequence? The gene sequence is very similar because the unknown species fossil goes through lots of leaves of bird lines on the branches. 4. What species has the least similar gene sequence as your gene of interest? The species that has the least similar gene sequence is the rodents and turtles species because there are only 4 leaves on the branch for rodents and 3 leaves on the branch for the turtles species. Gene 2: 1. What species has the most similar gene sequence as your gene of interest? The species that has the most similar gene sequence are flies compared to my gene of interest. 2. Where is that species located on the cladogram? The species is located 6 species above gene 2 on the cladogram. 3. How similar is that gene sequence? This gene has a 100% sequence similarity. 4. What species has the least similar gene sequence as your gene of interest? The species that has the least similar gene sequence is Pediculus Humanus compared to my gene of interest. Gene 3: 1. What species has the most similar gene sequence as your gene of interest? The species that has the most similar gene sequence is Taeniopygia Guttata compared to my gene of interest. 2. Where is that species located on the cladogram? The species is right about gene 3 on the cladogram. 3. How similar is that gene sequence? This gene has a 95% sequence similarity. 4. What species has the least similar gene sequence as your gene of interest? The species that has the least similar gene sequence is Sus Scrofa compared to my gene of interest. Gene 4: 1. What species has the most similar gene sequence as your gene of interest? The species that has the most similar gene is the alligator compared to my gene of interest. 2. Where is that species located on the cladogram? The alligator is located under gene 4. 3. How similar is that gene sequence? This gene has a 100% sequence similarity. 4. What species has the least similar gene sequence as your gene of interest? The species that has the least similar gene sequence is the Barbourula Busuangensis compared to my gene of interest. Investigation 4: BLAST Your Own Genes of Interest! Instructions: Now that the first part of the investigation is complete, the next step is to learn how to find and BLAST your own genes of interest. To locate a gene, go to the Entrez Gene web-site (http://www.ncbi.nlm.nih.gov/gene) and search for the gene. Once you have found the gene on the site, copy the gene sequence and input it into a BLAST query. Materials: 1. Chromebook 2. Internet Access 3. Entrez Gene Website 4. BLAST Website Follow the instructions below to BLAST your own gene of interest:
 Questions: In humans, what is the importance of the gene you chose? Would you expect to find that gene in all organisms? Why or why not? The gene I chose was GSN which is gelsolin and in humans, the importance of the gene I chose was the protein encoded by this gene binds to the "plus" ends of actin monomers and filaments to prevent monomer exchange. The encoded calcium-regulated protein functions in both assembly and disassembly of actin filaments. I would expect to find gelsolin in all organisms because it is important and it prevents monomer exchange and has calcium-regulated protein functions. Hypothesis: If humans and chimpanzees share 96% of their DNA, then gelsolin (GSN) will be beneficial to both humans and chimpanzees. Justification: According to the above results, this gene is present in all organisms because it regulates the function of cell growth and prevents monomer exchange and is therefore essential to both humans and chimpanzees. Conclusion: Since we found out in the above results that this gene is present in all organisms, the gelsolin gene will benefit both humans and chimpanzees and thus supporting my hypothesis. Overall, this lab gave me a greater understanding of how to create and read cladograms, analyze biological data, and connect and apply concepts pertaining to genetics and evolution. Errors that could have been made were inputting incorrect data from the information given in the lab or unintentionally typing the wrong gene sequence and getting incorrect data. However, both of my hypotheses were proven correct which makes this lab an overall success. |
